

As a product design intern, I designed multiple features for Funsport training system, including the student dashboard, enabling students to track personal goals, gain rewards with achievements, and track personal data. Student engagement rates increased by 7% with gamification design in student dashboard.
Funsport: Student Training Personal Dashboard


NetEase (网易) is a large tech company based in China. Their education product team is developing Funsport, an AI-powered, full-body, motion-tracking, and interactive kiosk that provides students with immersive trainings, progress management, and performance analysis. This case study portrays my development process of the student dashboard feature.
COMPANY

Product designer
Product Manager
ROLE
TEAM
12 members, including PMs, back-end and and testing engineers, and marketing
TIMELINE
May 2023 - Aug 2023
Figma (Design)
Conflunce (Documentations)
Jira (Implementation tracking)
TOOLS
Train, Record, Achieve, Reflect, and Grow.
THE CORE EXPERIENCE
01 / USER RESEARCH
Students are tired of current school training — repetitive, disorganized, and inefficient.
Students at Chinese middle schools lack motivation to consistently engage in school physicality trainings, and this is due to many reasons, such as shortage of P.E. teachers and disorganized training process. Through user interviews, field research, and desktop research, I was able to generate 3 insights.
Students do not enjoy current training process — tiring and repetitive.

Individual feedback & analysis is rarely received — hard to improve.

Middle school students are engaged by competition / games, with social elements.

Identifying opportunities in their journey
Based on research, I created a journey map that pins pain points as well as opportunities.

How might we provide motivation, rewards, and analysis for a training journey?
02 / IDEATION
I built the first prototype of the student center with 3 main components — badges, to reward training and display achievements; goals, to visualize progress and incentive actions; and performance & analysis, to provide data analysis and feedback.


03 / CONCEPT DEVELOPMENT & VALIDATION
Replacing big goals with small tasks.
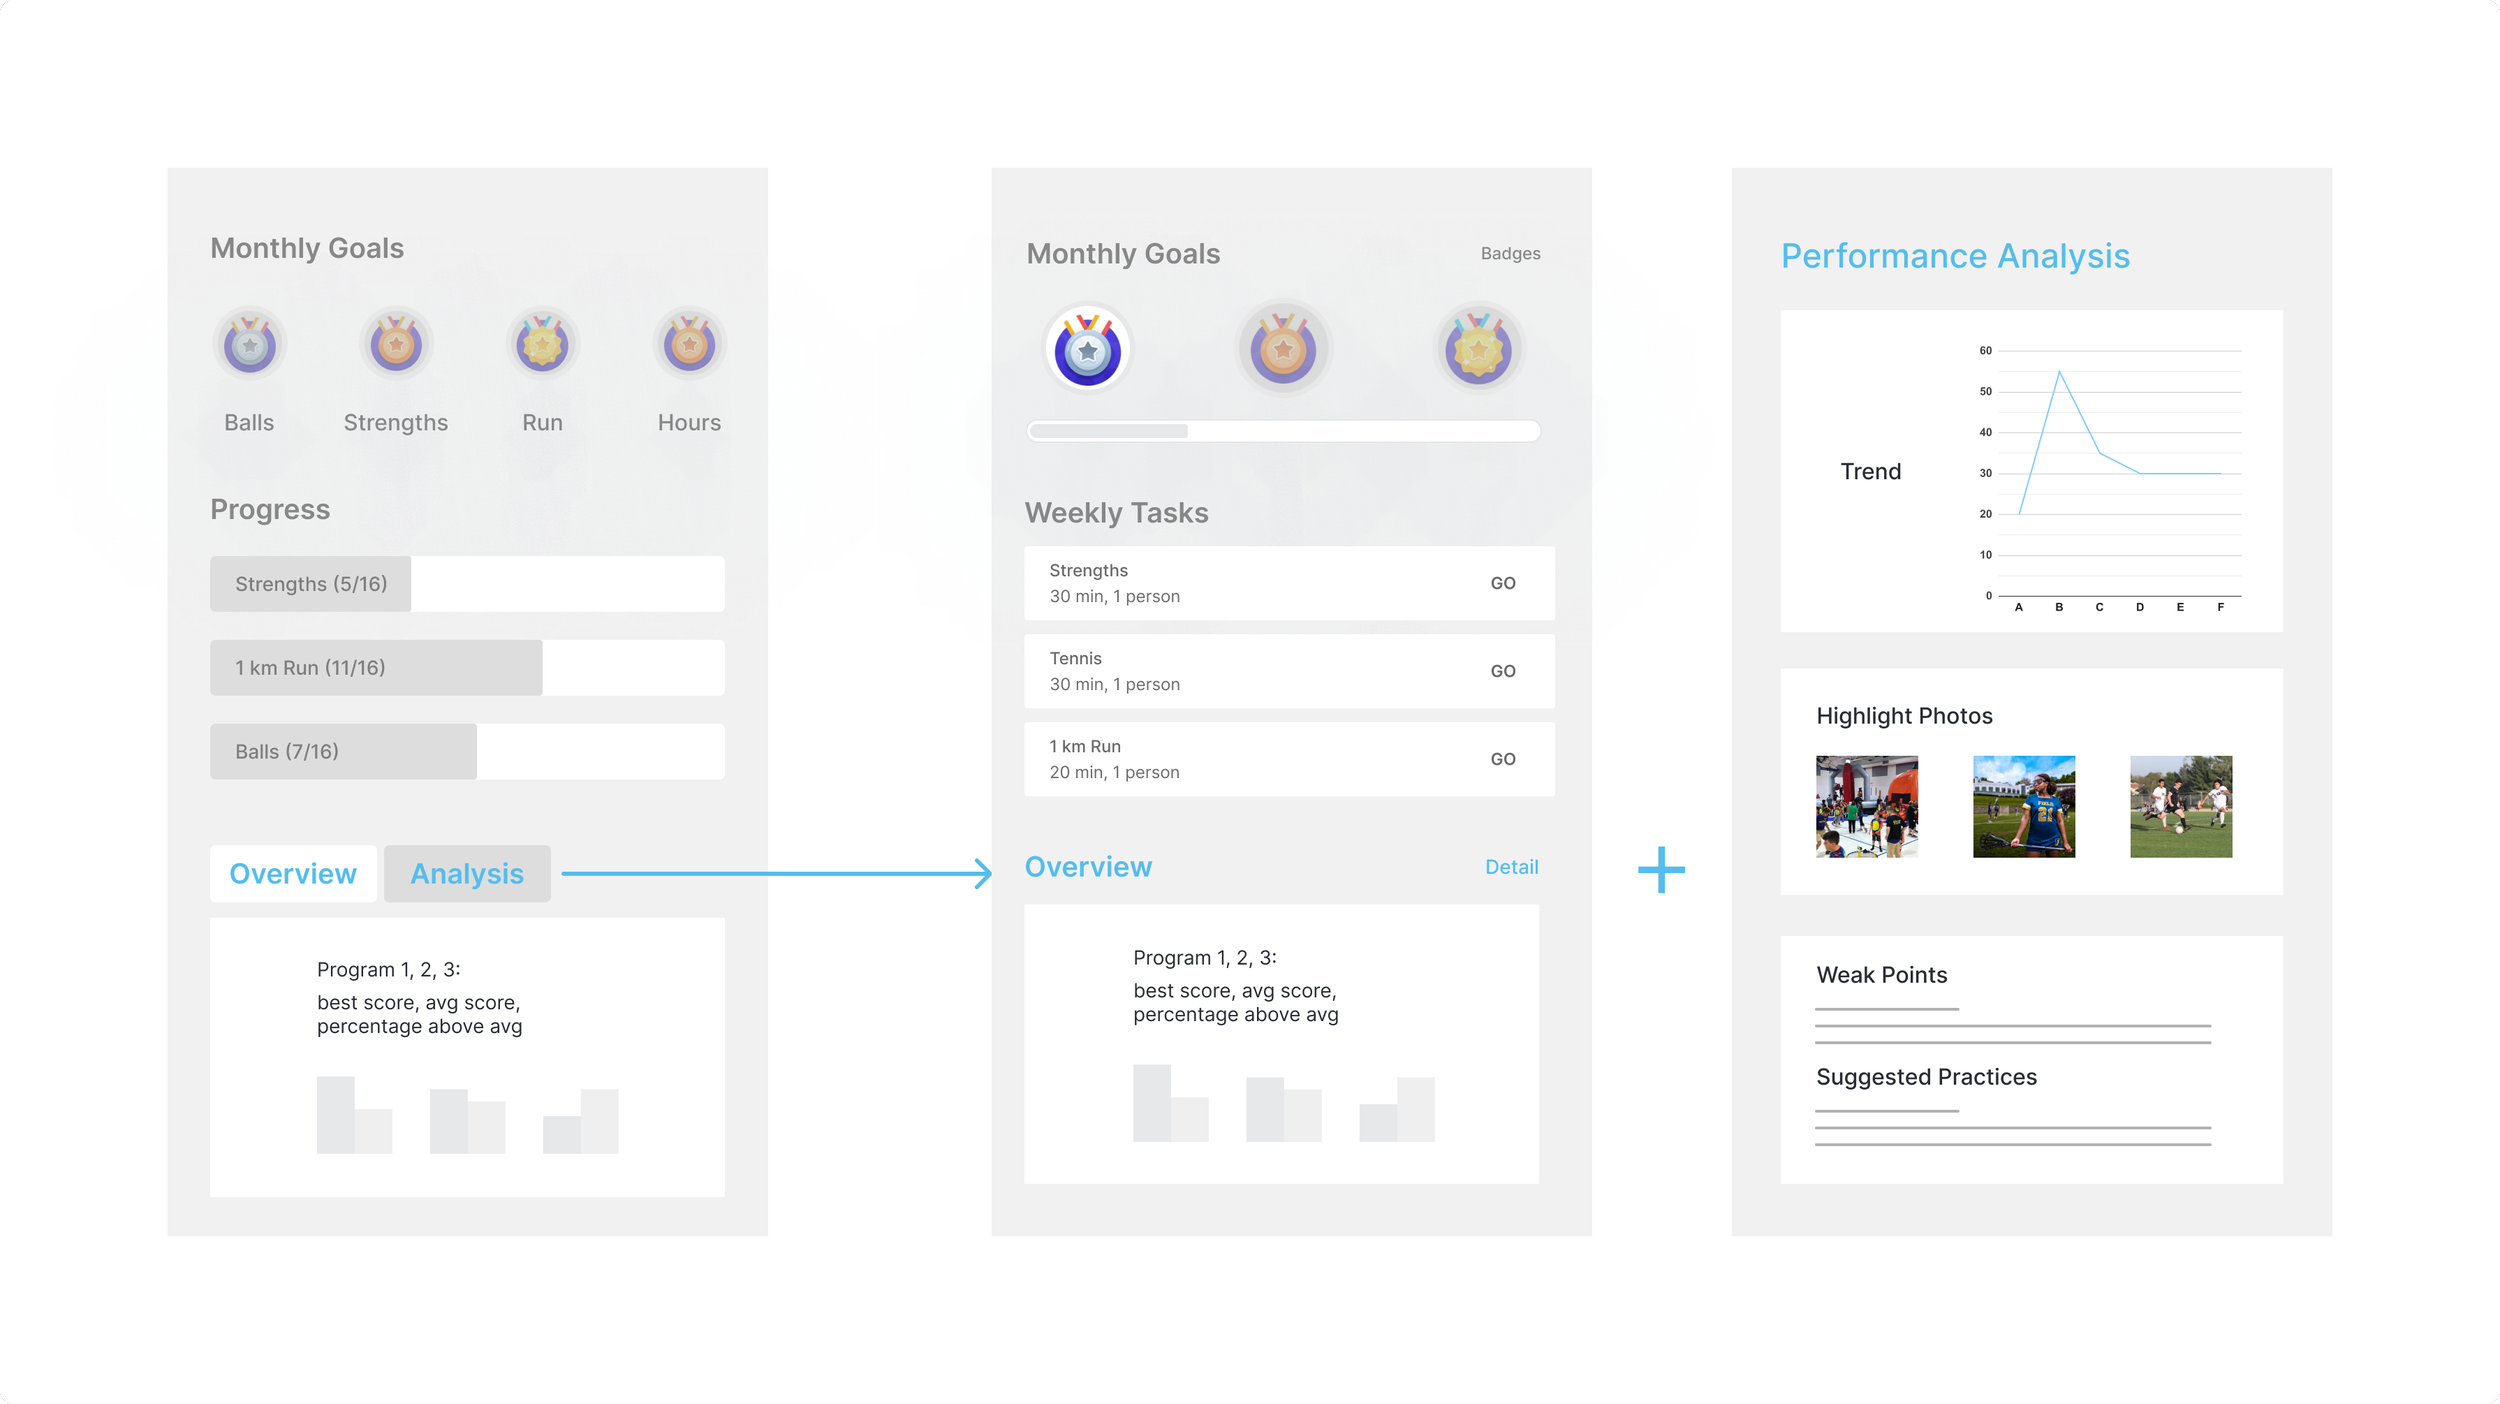
In concept development phase, I developed quick prototypes and gathered feedback on my ideas. One important feedback was that the progress bar is disincentivizing, because it takes a month to fulfill that progress and gain a badge. To solve this problem, I decided to introduce “weekly tasks” to break down large goals into small tasks, making it easier to get started and gain rewards.

Expanding analysis to support additional use cases.
Another feedback I gathered was that switching between the 2 tabs are not intuitive, and students expect more information when they jump to the analysis section. Therefore, I decided to add a detail page to the overview section, so that students can glance at their performance on the front page, and browse more detailed analysis on a separate page when they are interested.
Gamifying the badge collection process to increase training motivation.
To make the training process engaging in the long term, I wanted to replace ordinary badges with rewarding badges with themes. Coming up with a travel theme, I thought turning the training process into a kind of adventure — allowing students to travel to different countries and gaining city badges through their hard work, would be attractive to students. Indeed, the concept turned out very popular among students.

04 / INTERACTION DESIGN
Promoting information hierarchy and intuitive interactions through structure and mapping.
To make sure the travel map idea communicates effectively with students, I explored different ways to get the idea across. Exploring floating menus and country shapes, I eventually landed on a design that resembles the real map, embedded in an interactive window, and has intuitive element mapping.

Enabling a holistic view of performance with key data sections at a glance.
The goal of the training analysis section is to communicate key performance data effectively. With a straightforward section structure, students can access all pertinent information at a glance.

05 / KEY FEATURES & IMPACTS
Train, starting now.
Students can view their progress, start training, and check out performance overview at the dashboard homepage.
Gamifying training — travel adventures
Students can visit different countries each month — collect city badges and learn about fun facts!
Detailed performance report at one tap.
Students can access monthly data, highlight albums, and analysis reports by clicking into performance details.
Engagement rose, and schools are happy.
7%
Increase in monthly training participation
150k+
Total users in schools across China
88%
Positive customer feedback
Driving Growth Through Design.
This design project is strictly tied with the business strategy of Funsport.The goal is not only to improve user experience, but also increase growth. In this experience, I learned how to incorporate behavioral principles and gamification to realize engagement growth, and how to collaborate with cross-functional teams to measure reception and impacts.
Evolving the Experience: What Comes Next
As my internship concludes, the development of this feature will keep going. Future development I proposed was to refine the detailed interactions in the badge map section, and envisioning collaborative training. For example, if student accounts can be interconnected to show comparative ranking, achievements, or cooperate to train together, more growth are expected.
The End. Redirecting you to…

Architecture AI

Outdoor Navigation

Craft Community